[PART SIX] COSTS TO DIOCESES AND RELIGIOUS
COMMUNITIES |
6.1 TOTAL COSTS
This section reports the costs to dioceses and religious communities of responding to allegations of child sexual abuse by priests between the years 1950 and 2002. Costs to dioceses are reported separately from costs to religious communities. Some dioceses and religious communities did not report cost data for certain questions because either there were no expenditures or the survey contained missing data. The data in the following tables are limited to the number of dioceses and religious communities that reported expenditures. With the exception of Table 6.1.1, which is based on reports from Diocesan/Order Profiles only, dollar amounts are based on data from the Victim Surveys.
Of all dioceses and religious communities that had submitted a Diocesan/Order Profile, approximately 80% contained a reportable figure for compensation paid to those who had alleged abuse. Total costs by type of expenditure are shown in Table 6.1.1 and the proportions of dioceses and religious communities reporting expenditure figures are shown in Table 6.1.2. The total compensation paid by dioceses to alleged victims by region of the country is shown in Table 6.1.3. The proportion of diocesan expenditures for victim compensation that was covered by insurance was about 60% (see Table 6.1.4). Nearly three-quarters of dioceses had a reportable figure for alleged victim treatment expenditures (see Table 6.1.5) but only 30% of the dioceses reported insurance coverage cost data for such treatment (see Table 6.1.6). Just over 60% of the dioceses reported cost data for priest treatment (see Table 6.1.7), and roughly 30% of the dioceses gave an insurance coverage figure for this treatment (see Table 6.1.8). Sixty-two percent of the dioceses also reported a figure for attorney fees paid for allegations of child sexual abuse by priests (see Table 6.1.9).
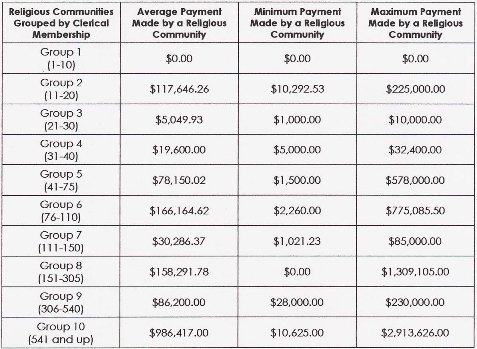
Of all religious communities participating in the study, approximately 60% reported a figure for total compensation for alleged victims (see Table 6.1.10) and one-quarter were able to give an insurance coverage figure (see Table 6.1.11). Nearly half of all religious communities reported cost data for victim treatment (see Table 6.1.12), but only 10% had data for insurance coverage of victim treatment (see Table 6.1.13). About 40% of the respondent religious communities had data for priest treatment costs (see Table 6.1.14), and just over 10% reported insurance coverage for this treatment (see Table 6.1.15). Half of the religious communities reported cost figures for attorney fees (see Table 6.1.16).
These cost figures have several limitations. The total compensation figures in Table 6.1.3 are not reliable since some reports include victim treatment costs in the total compensation figure (one of the survey questions asked for the approximate total compensation or payment to the victim), thereby inflating the compensation sum in these reports. Additionally, there are more than one thousand pending legal cases that have not yet reported a compensation figure for alleged victims, or resolved the amount of attorneys’ fees. In cases where large-scale settlements have been made, some dioceses were unable to report a compensation figure at the victim level because the victims’ attorney had not yet dispersed the money to the victims.
Similarly, some dioceses were unable to report an attorney fee at the victim level because the attorney for the diocese may have represented the diocese in cases brought by multiple victims concurrently. An additional limitation to consider regarding the reported treatment costs for priests is that many victim surveys for one particular priest also contained the same cost figure for priest treatment. The priest treatment figures, then, may be inflated due to multi-counting. A further caution about the overall costs arises because some respondents reported overall cost data on the Diocesan/Order Profile, but did not send in the Cleric and Victim Surveys providing details for how this money was spent.
Several steps were taken to assure the validity of these cost statistics All potential duplicative victim treatment costs were identified, and double counting was eliminated. Because attorney fees were reported at the victim level, those which were deemed to represent representation of a group, were divided by the number of victims that generated that attorney fee. For example, 25 Victim Surveys associated with a single priests and showing a $25 million fee would be divided by 25, resulting in a $1 million attorney fee for that survey. Most dioceses and religious communities that sent expenditure information on the Diocesan/Order Profiles provided detailed information about those costs in the Victim Surveys.
Table 6.1.1 TOTAL COSTS PAID BY DIOCESES AND RELIGIOUS COMMUNITIES, BY TYPE OF EXPENDITURE
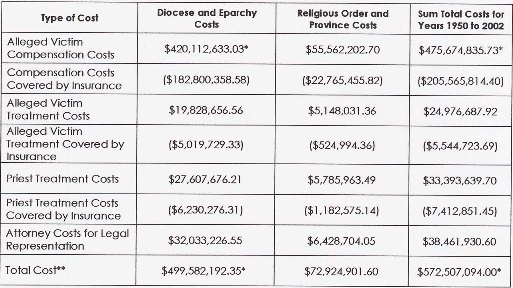 |
*These figures do not include the highly publicized settlement figure of $85 million in the Archdiocese of Boston. No Diocesan Profile contained a data point with this specific total compensation amount.
**The total cost represents rows 1,3, 5, and 7 because insurance coverage is already included in these figures. The insurance figures are placed in parentheses to indicate that they are not additive, as they are part of the total compensation and treatment.
Table 6.1.2 NUMBER AND PERCENT OF DIOCESES AND RELIGIOUS COMMUNITES REPORTING COSTS, BY TYPE OF EXPENDITURE
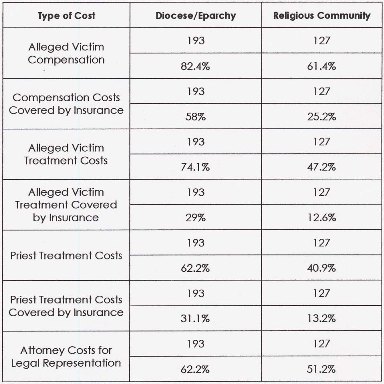 |
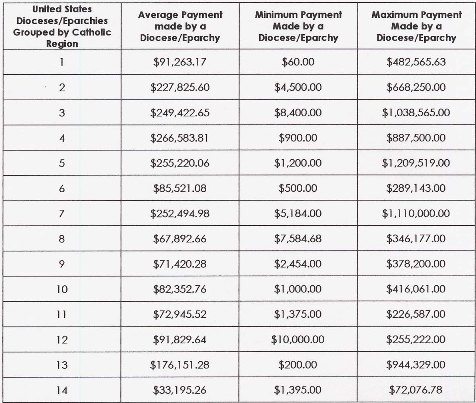
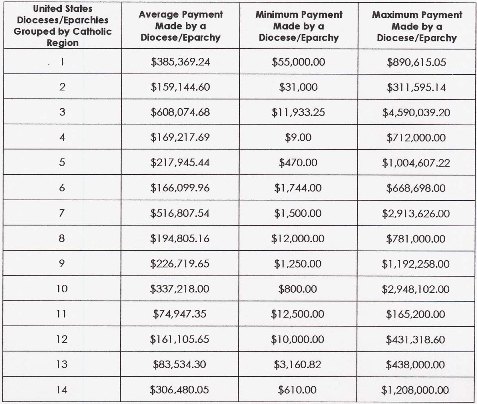
Table 6.1.3 COMPENSATION PAID BY DIOCESES TO ALLEGED VICTIMS, BY REGION
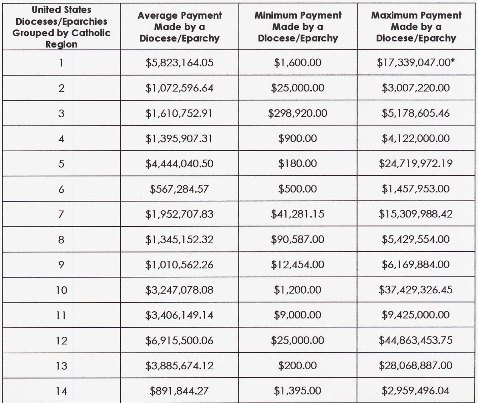 |
This Table does not include the highly publicized settlement figure of $85 million in the Archdiocese of Boston. No Diocesan Profile contained a data point with this specific total compensation amount. Payment figures may reflect either payment to a group or a single individual.
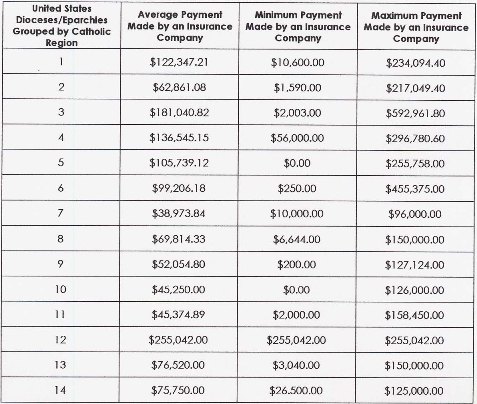
Table 6.1.4 VICTIM COMPENSATION PAID BY DIOCESES AND COVERED BY INSURANCE, BY REGION
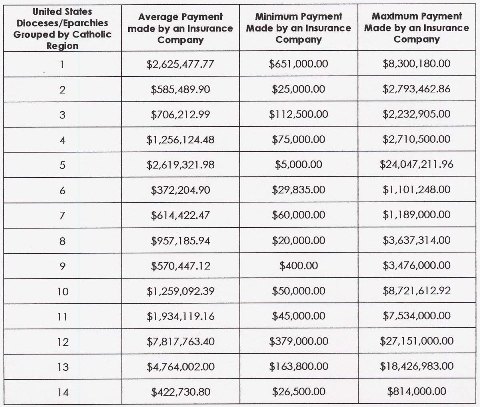 |
In some instances the insurance carrier paid a greater sum to an alleged victim than a particular diocese. This table does not include the highly publicized settlement figure of $85 million in the Archdiocese of Boston. No Diocesan Profile contained a data point with this specific total compensation amount. Payment figures may reflect either a group’s or a single individual’s payment.
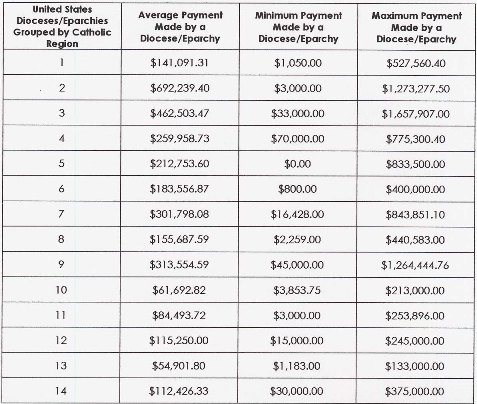
Table 6.1.5 VICTIM TREATMENT COSTS PAID BY DIOCESES, BY REGION
 |
These amounts represent the combined total of victim treatment costs incurred by both dioceses and insurance companies. This Table does not include the highly publicized settlement figure of $85 million in the Archdiocese of Boston. No Diocesan Profile contained a data point with this specific total compensation amount. Payment figures may reflect either a group’s or a single individual’s payment.
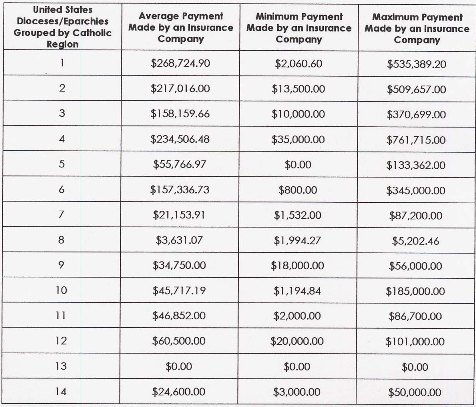
Table 6.1.6 VICTIM TREATMENT COSTS PAID BY INSURANCE COMPANIES FOR DIOCESAN PRIESTS, BY REGION
 |
This Table does not include the highly publicized settlement figure of $85 million in the Archdiocese of Boston. No Diocesan Profile contained a data point with this specific total compensation amount. Payment figures may reflect either a group’s or a single individual’s payment.
Table 6.1.7 TREATMENT EXPENDITURES FOR DIOCESAN PRIESTS, BY REGION
 |
This Table does not include the highly publicized settlement figure of $85 million in the Archdiocese of Boston. No Diocesan Profile contained a data point with this specific total compensation amount. Payment figures may reflect either a group’s or a single individual’s payment.
Table 6.1.8 TREATMENT EXPENDITURES FOR DIOCESAN PRIESTS COVERED BY INSURANCE, BY REGION
 |
This Table does not include the highly publicized settlement figure of $85 million in the Archdiocese of Boston. No Diocesan Profile contained a data point with this specific total compensation amount. Payment figures may reflect either a group’s or a single individual’s payment.
Table 6.1.9 ATTORNEYS FEES PAID BY DIOCESES, BY REGION
 |
This Table does not include the highly publicized settlement figure of $85 million in the Archdiocese of Boston.
Table 6.1.10 VICTIM COMPENSATION PAID BY RELIGIOUS COMMUNITIES, BY SIZE OF RELIGIOUS COMMUNITY
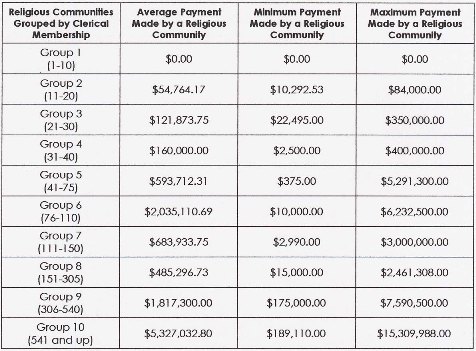 |
Table 6.1.11 COMPENSATION FOR ALLEGED VICTIMS COVERED BY INSURANCE, BY SIZE OF RELIGIOUS COMMUNITY
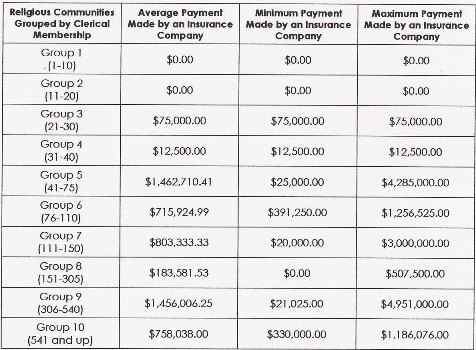 |
In some instances the insurance carrier paid a greater sum to an alleged victim than a particular religious community.
Table 6.1.12 TREATMENT COSTS FOR ALLEGED VICTIMS, BY SIZE OF RELIGIOUS COMMUNITY
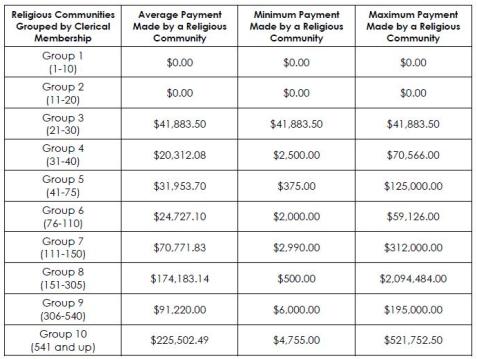 |
Table 6.1.13 VICTIM TREATMENT COSTS COVERED BY INSURANCE, BY SIZE OF RELIGIOUS COMMUNITY
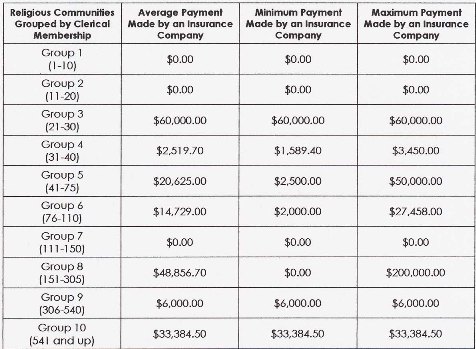 |
Table 6.1.14 TREATMENT COSTS FOR RELIGIOUS PRIESTS, BY SIZE OF RELIGIOUS COMMUNITY
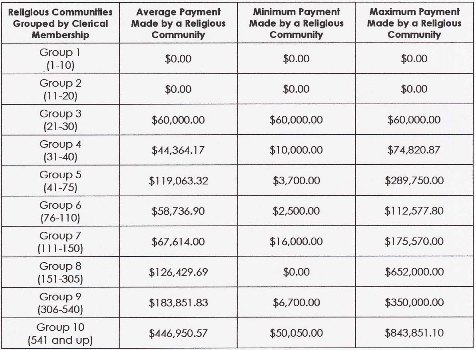 |
Table 6.1.15 TREATMENT COSTS FOR RELIGIOUS PRIESTS COVERED BY INSURANCE, BY SIZE OF RELIGIOUS COMMUNITY
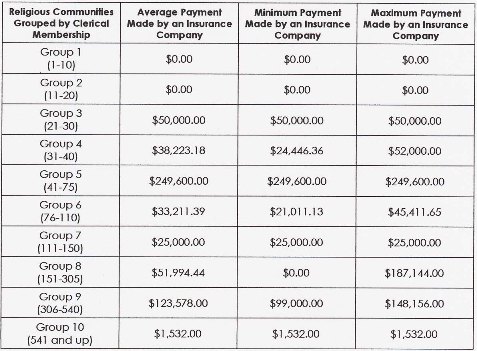 |
Table 6.1.16 ATTORNEY FEES PAID BY RELIGIOUS COMMUNITIES, BY SIZE OF RELIGIOUS COMMUNITY
 |
[Continue to the Appendix or return to Table of Contents.]